Ranx
Analytics
What’s the point of collecting all this survey data if you don’t know what to do with it!
Ranx analysis answers the question – Where to focus to have the most impact?
Ranx identifies the survey categories and measures that have the greatest potential for influence and improvement!
Survey
Analyze
Improve
Ranx Analytics Example
Rank Order Centroid (ROC) is a method of giving weights to a number of items ranked according to their importance.
Try our Rank Order Centroid (ROC) tool below to see how rankings affect item weights. Add and remove items to see the impact.
Simple pricing plans for every budget
SAVE up to 60% with Annual Multi-User Plans
Free
$0
per
month
blank
1 User
Unlimited Private Surveys
Starter
$9
per
month
or $72 per year (33% off)
1 User
Filter Analytics
Advanced
$49
per user
per month
1 User
21
(00% off)
$39
per user
per month
2 Users
|
(20% off)
$29
per user
per month
3+ Users
(40% off)
Automated Workflows
Premium
$99
per user
per month
1 User
21
(00% off)
$79
per user
per month
2 Users
|
(20% off)
$59
per user
per month
3+ Users
(40% off)
Publish Results
Free
$0
per
month
blank
1 User
Unlimited Private Surveys
Starter
$6
per
month
(33% off)
$72 billed annually
1 User
Filter Analytics
Advanced
$39
per user
per month
1 User
21
(20% off)
$25
per user
per month
2 Users
|
(50% off)
$19
per user
per month
3+ Users
(60% off)
Automated Workflows
Premium
$79
per user
per month
1 User
21
(20% off)
$50
per user
per month
2 Users
|
(50% off)
$39
per user
per month
3+ Users
(60% off)
Publish Results
Know what matters!
Ranx analytics provides Net Survey Performance and identifies Prioritized Improvement Opportunities – so you can act
Survey Category Analysis
Category importance and the net scores of the questions in each.
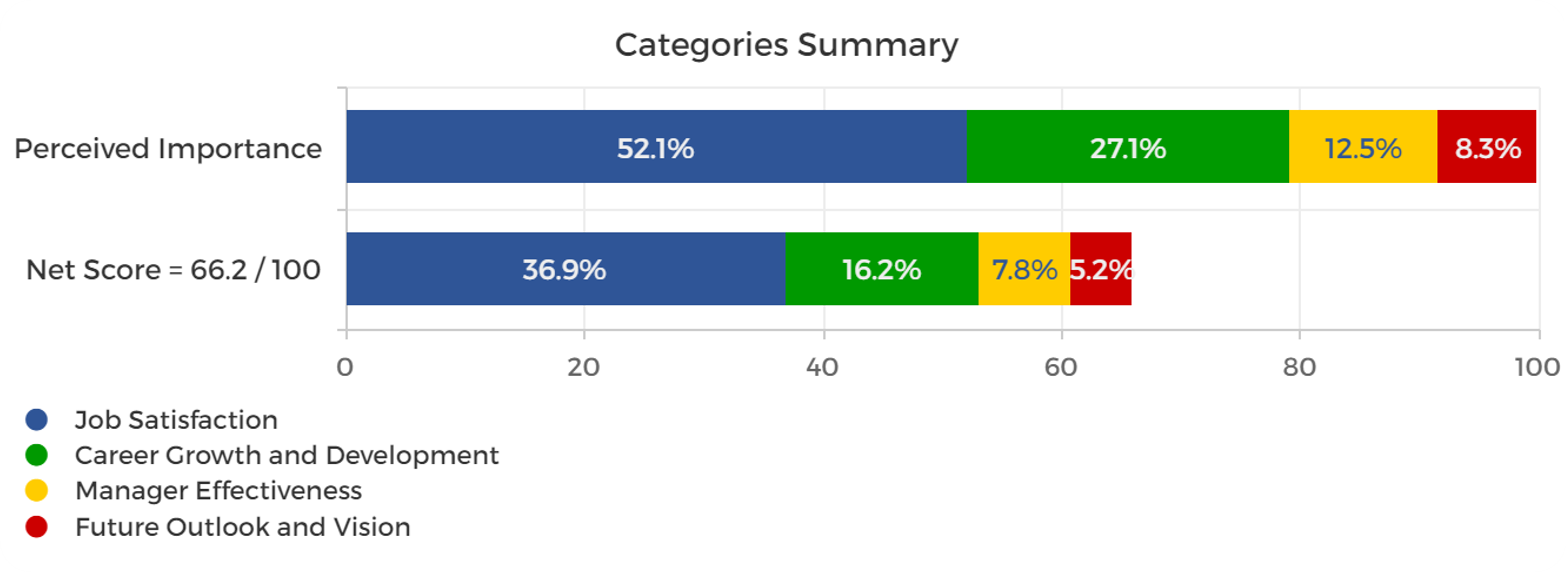
Bulletized view of category importance & performance.
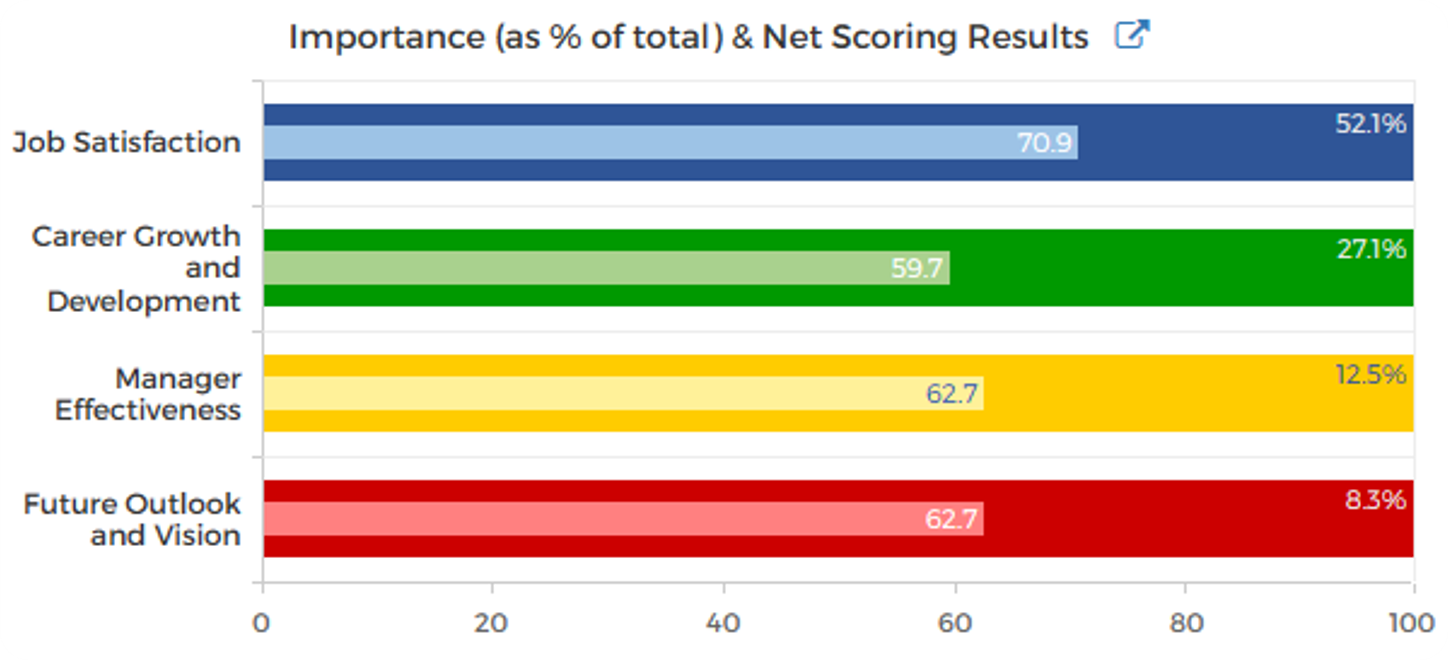
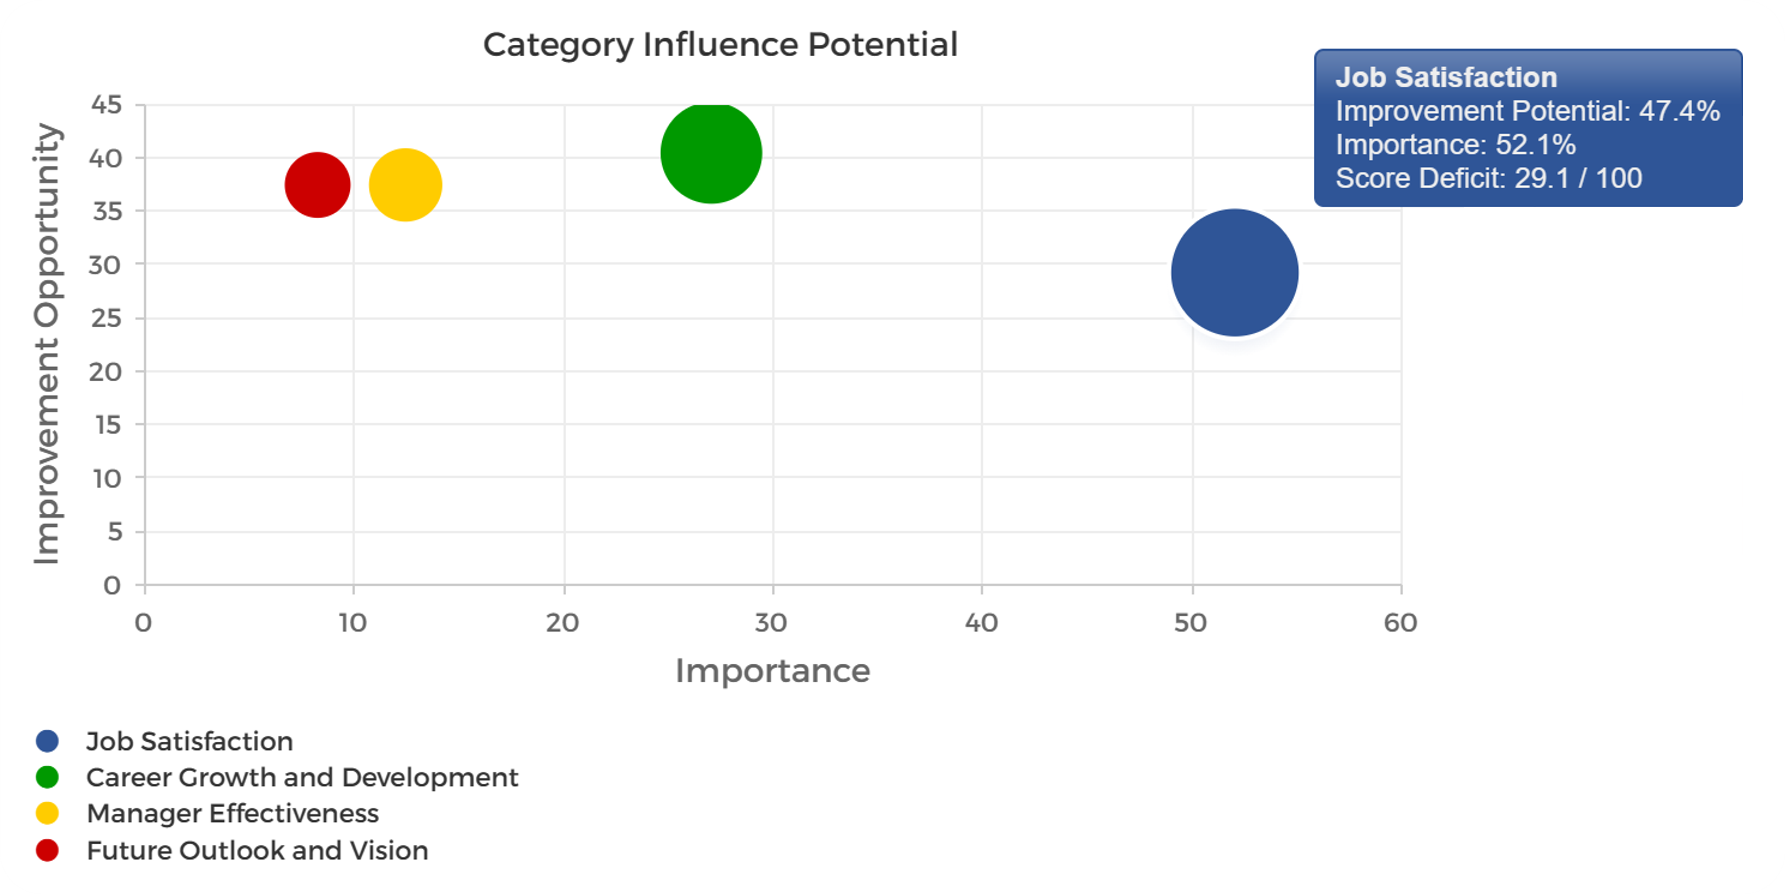
How much can improving a category influence performance.
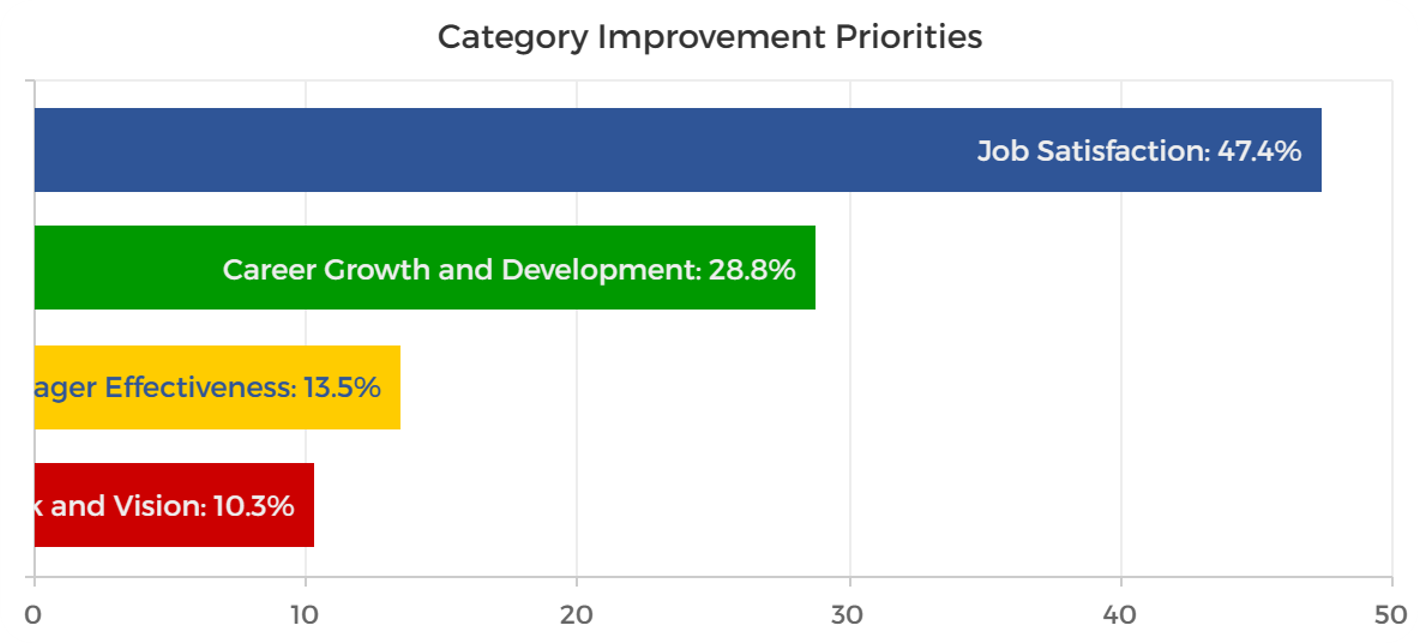
Prioritized bar chart view of influence potential.
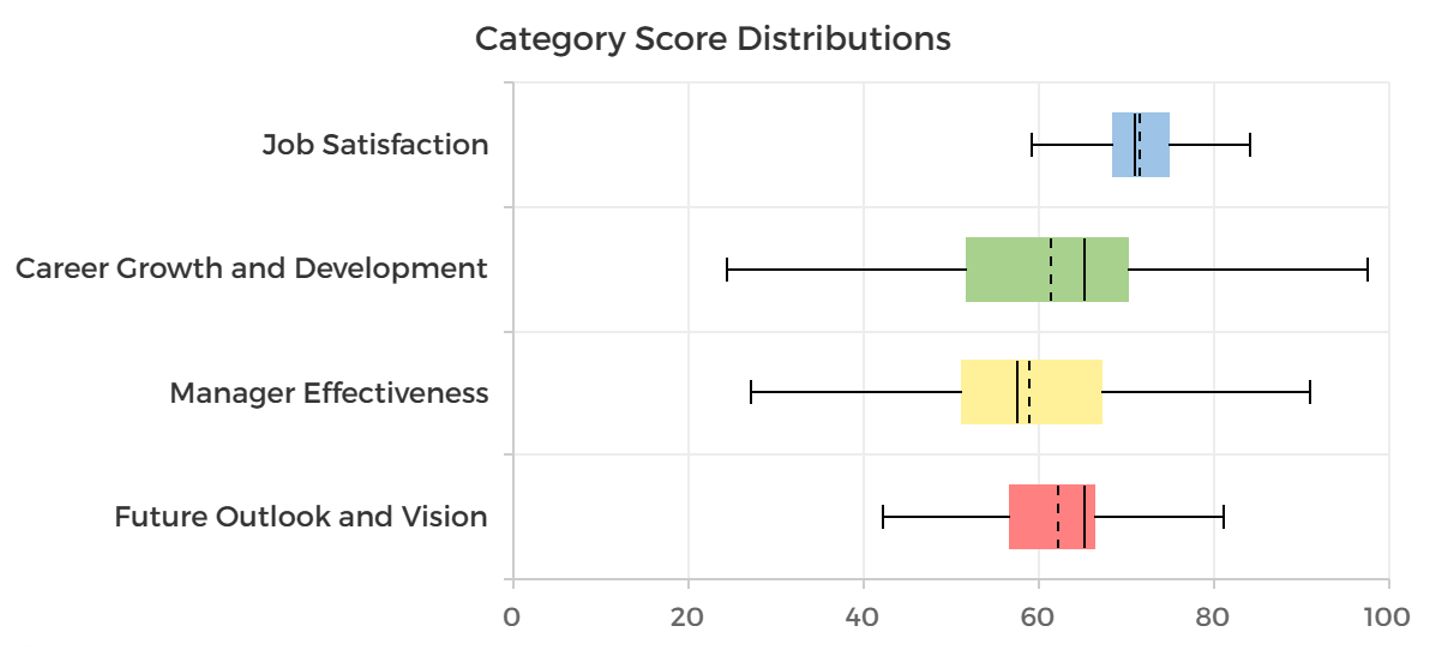
Do your respondents agree about category importance?
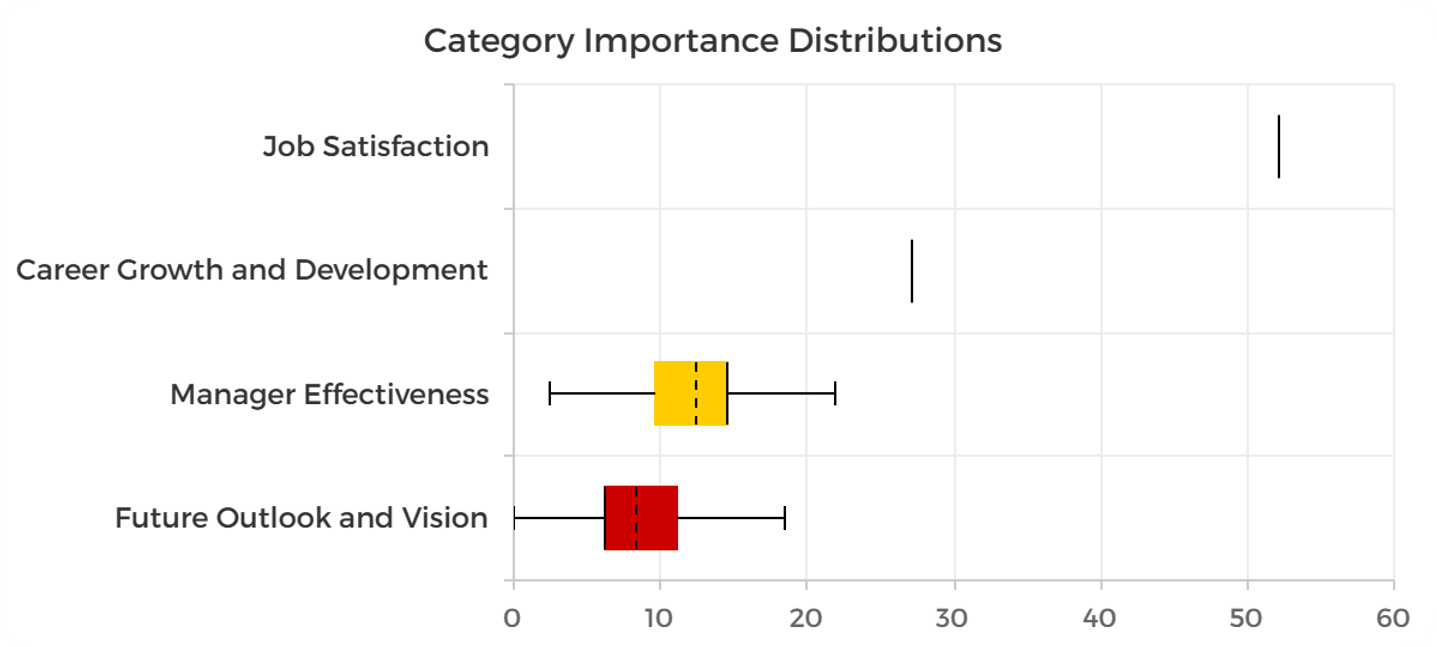
Questions score variance within each category.
Survey Question Analysis
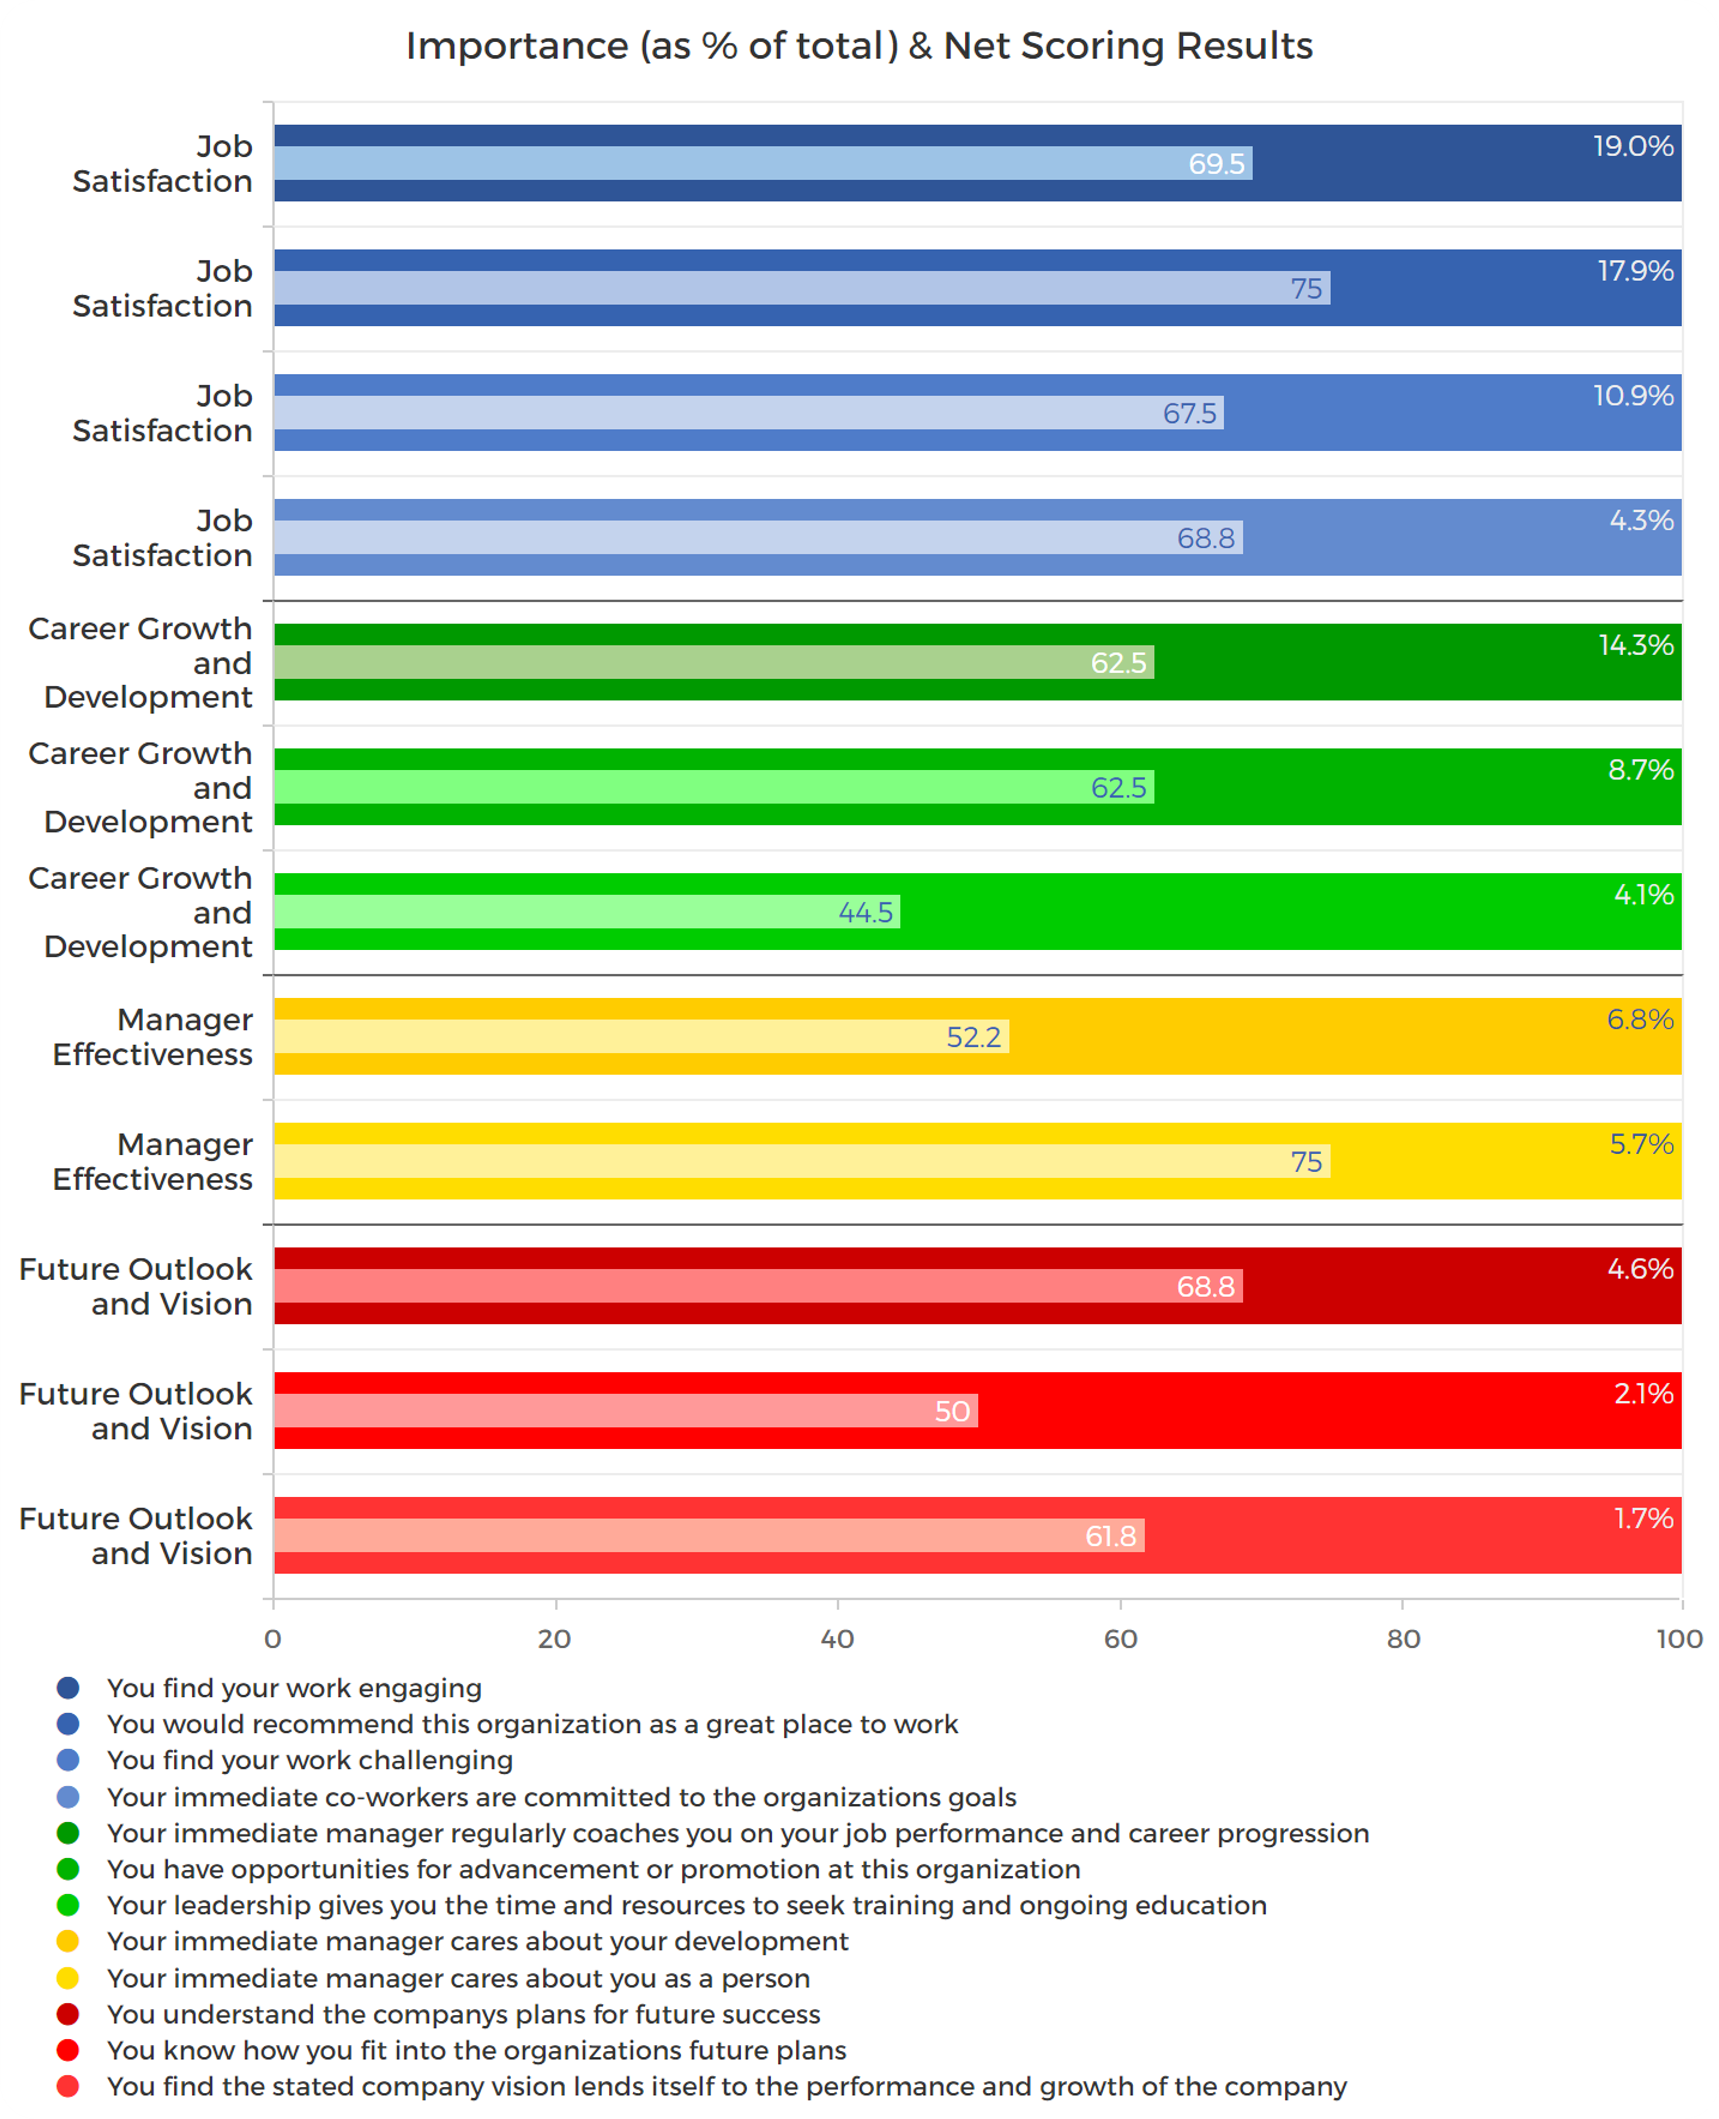
Question importance and the net scores of each.
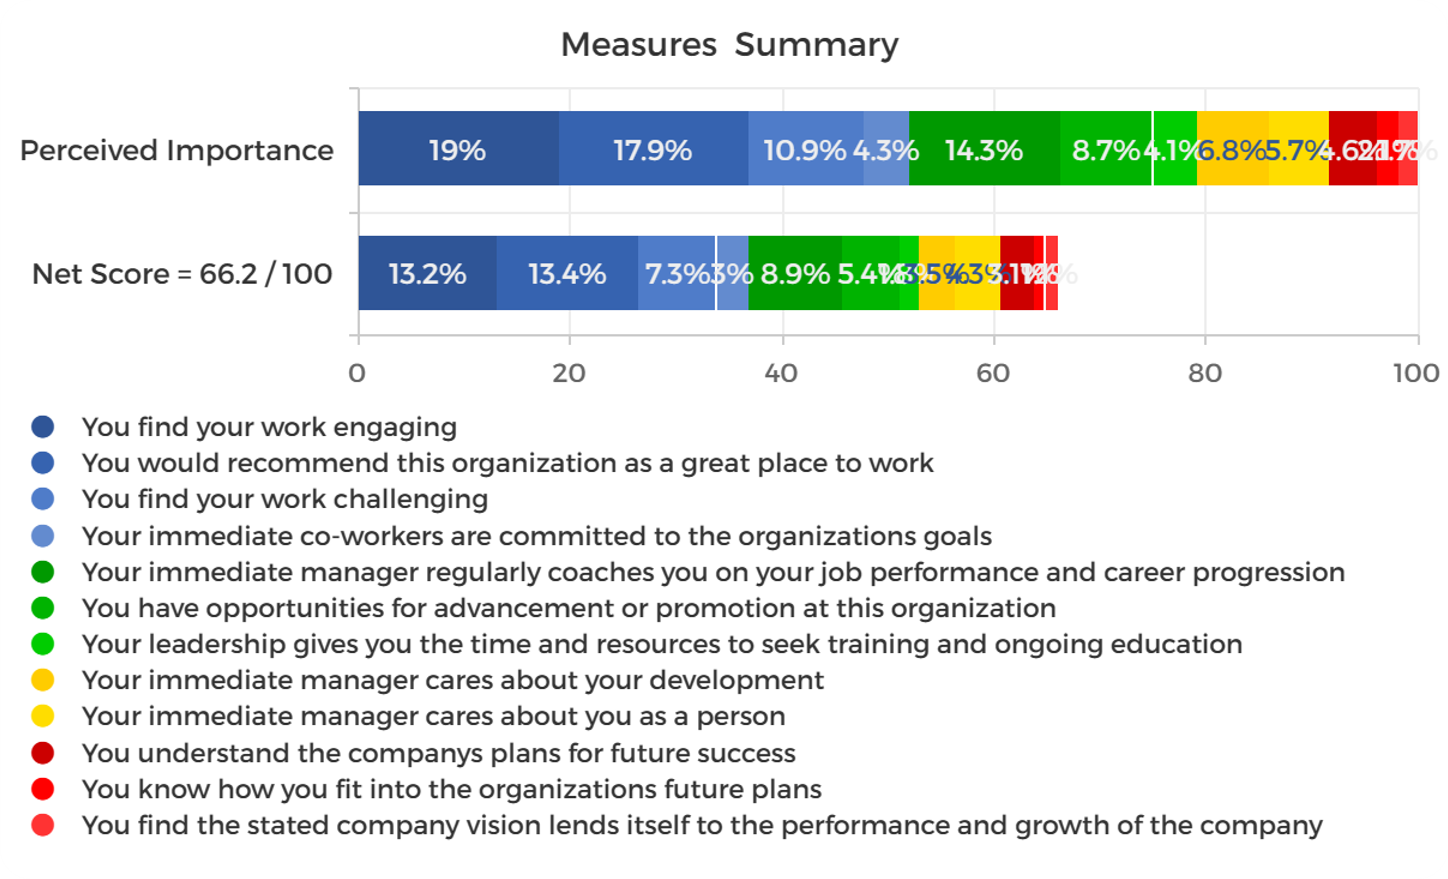
Question importance & scores.
Question influence potential.
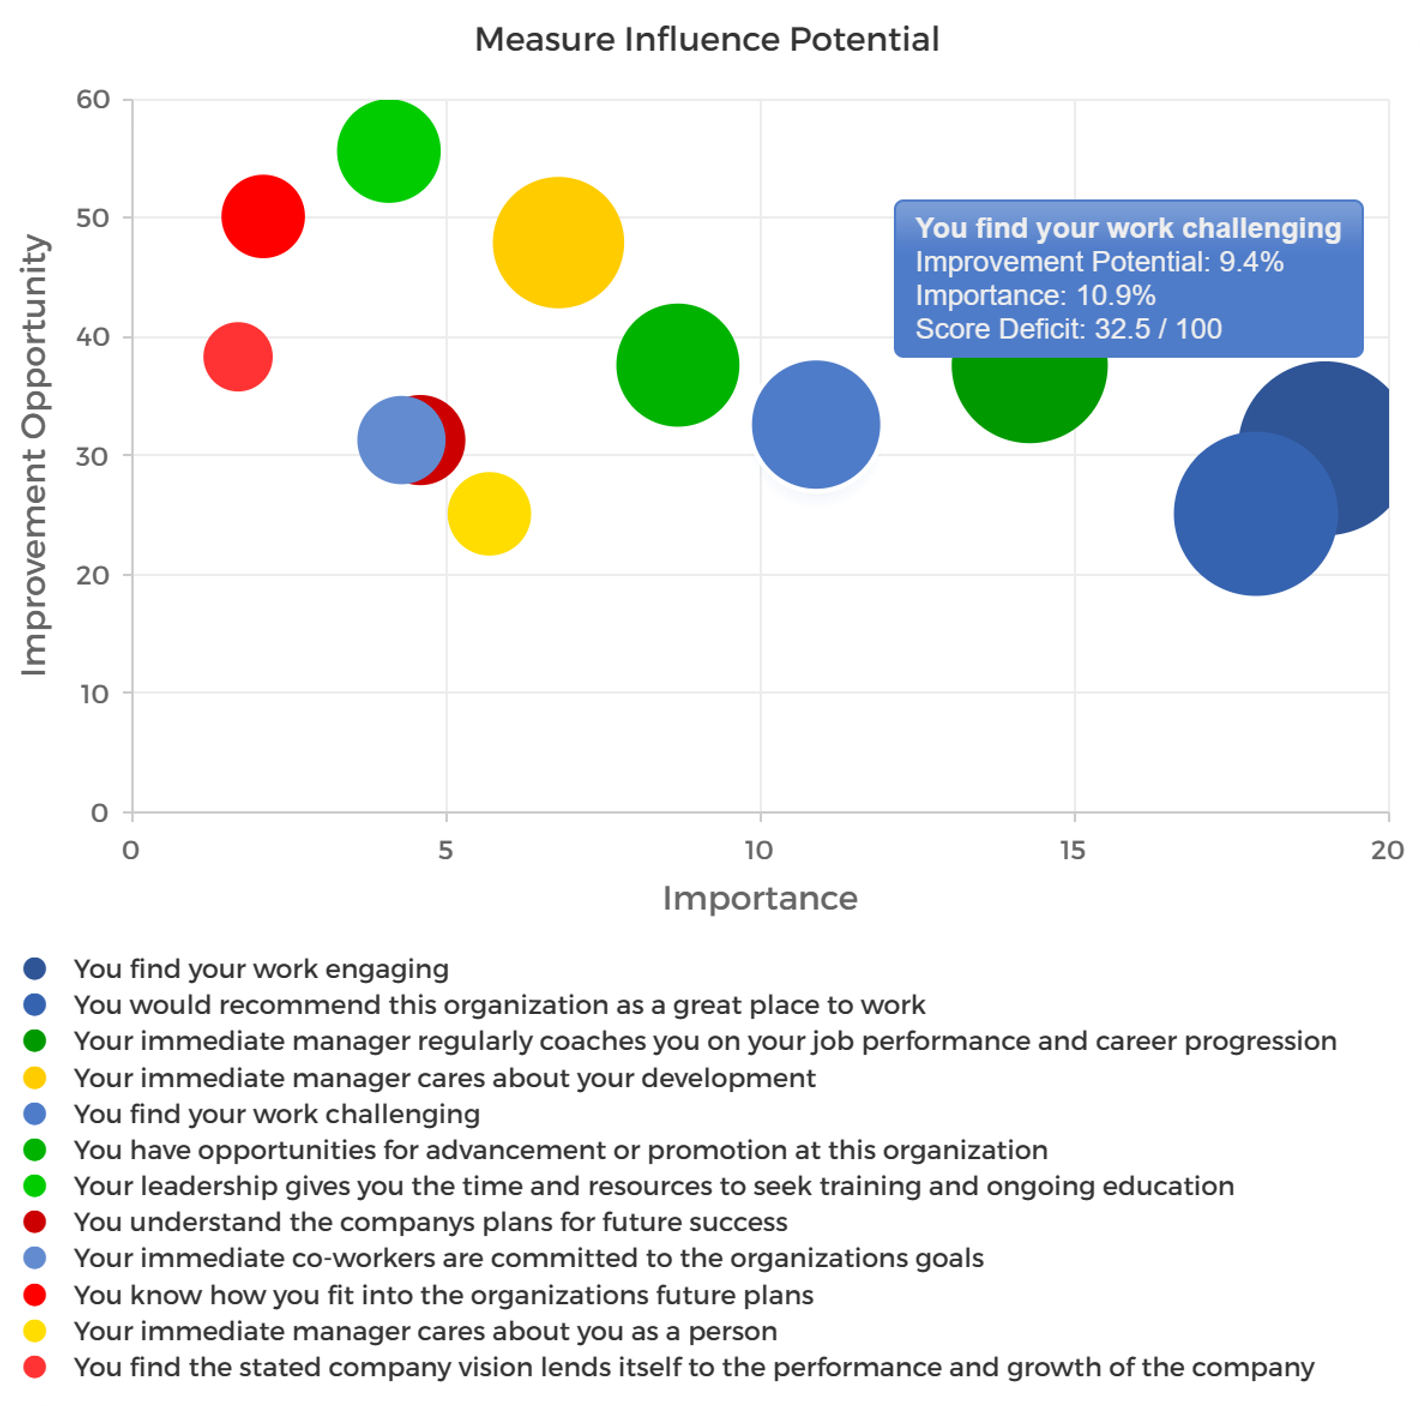
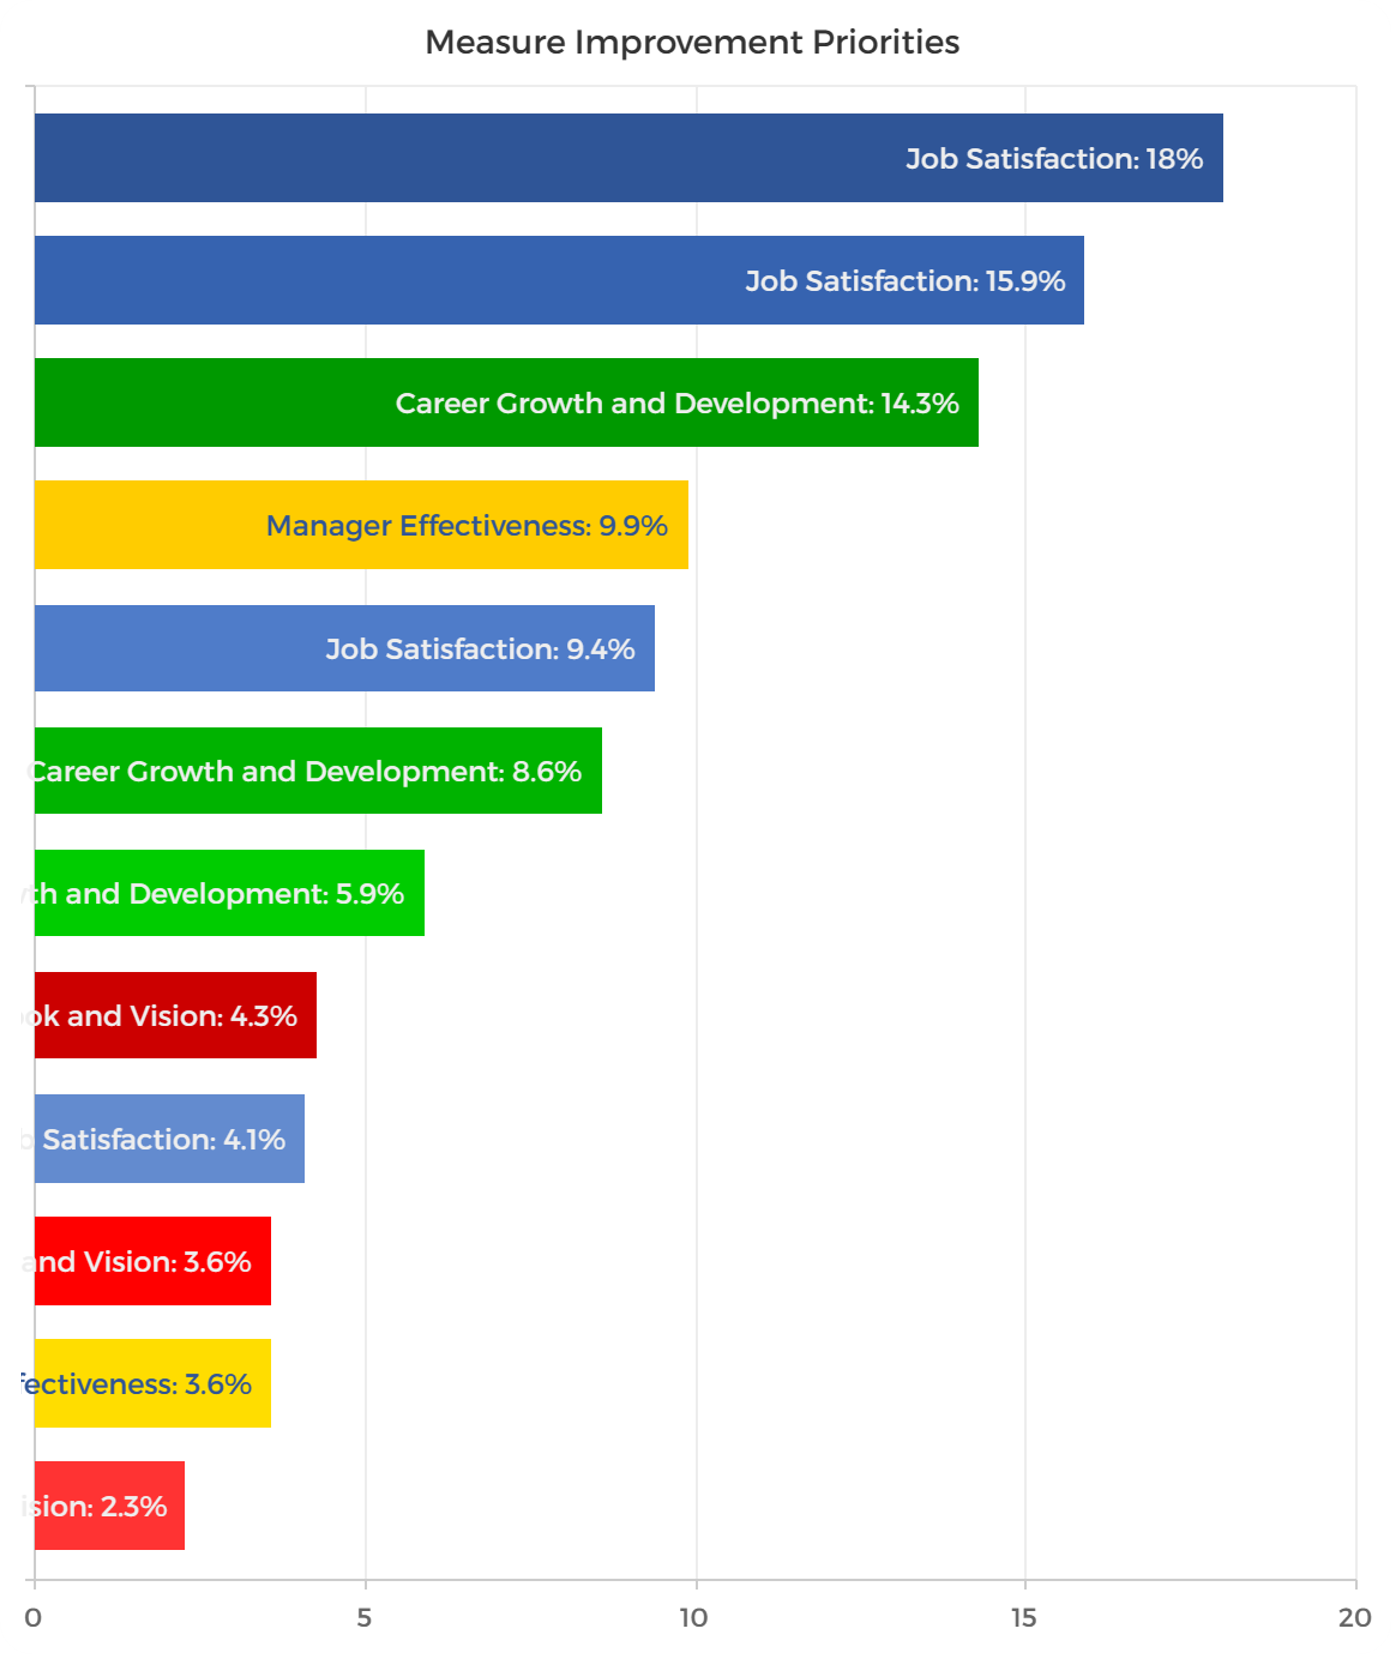
Prioritized influence potential.
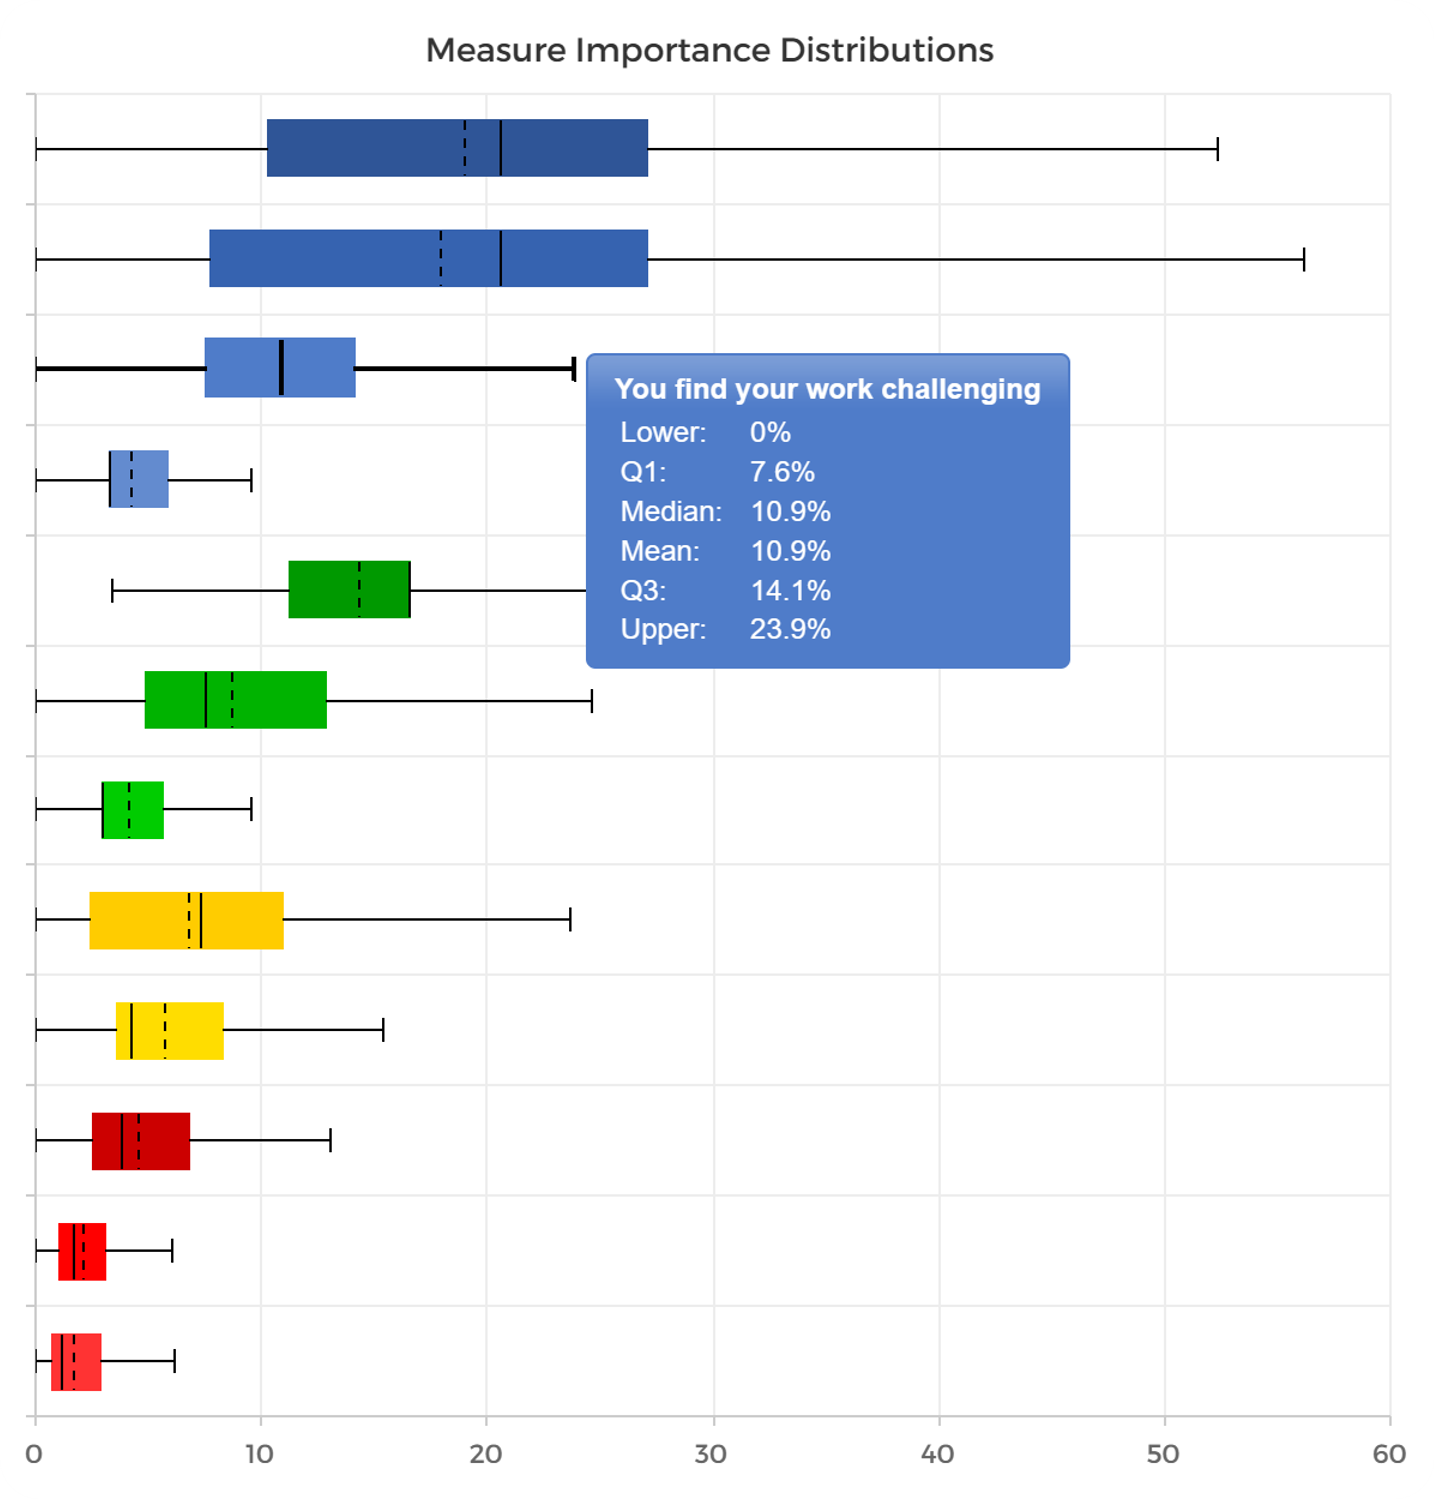
Question importance distributions.
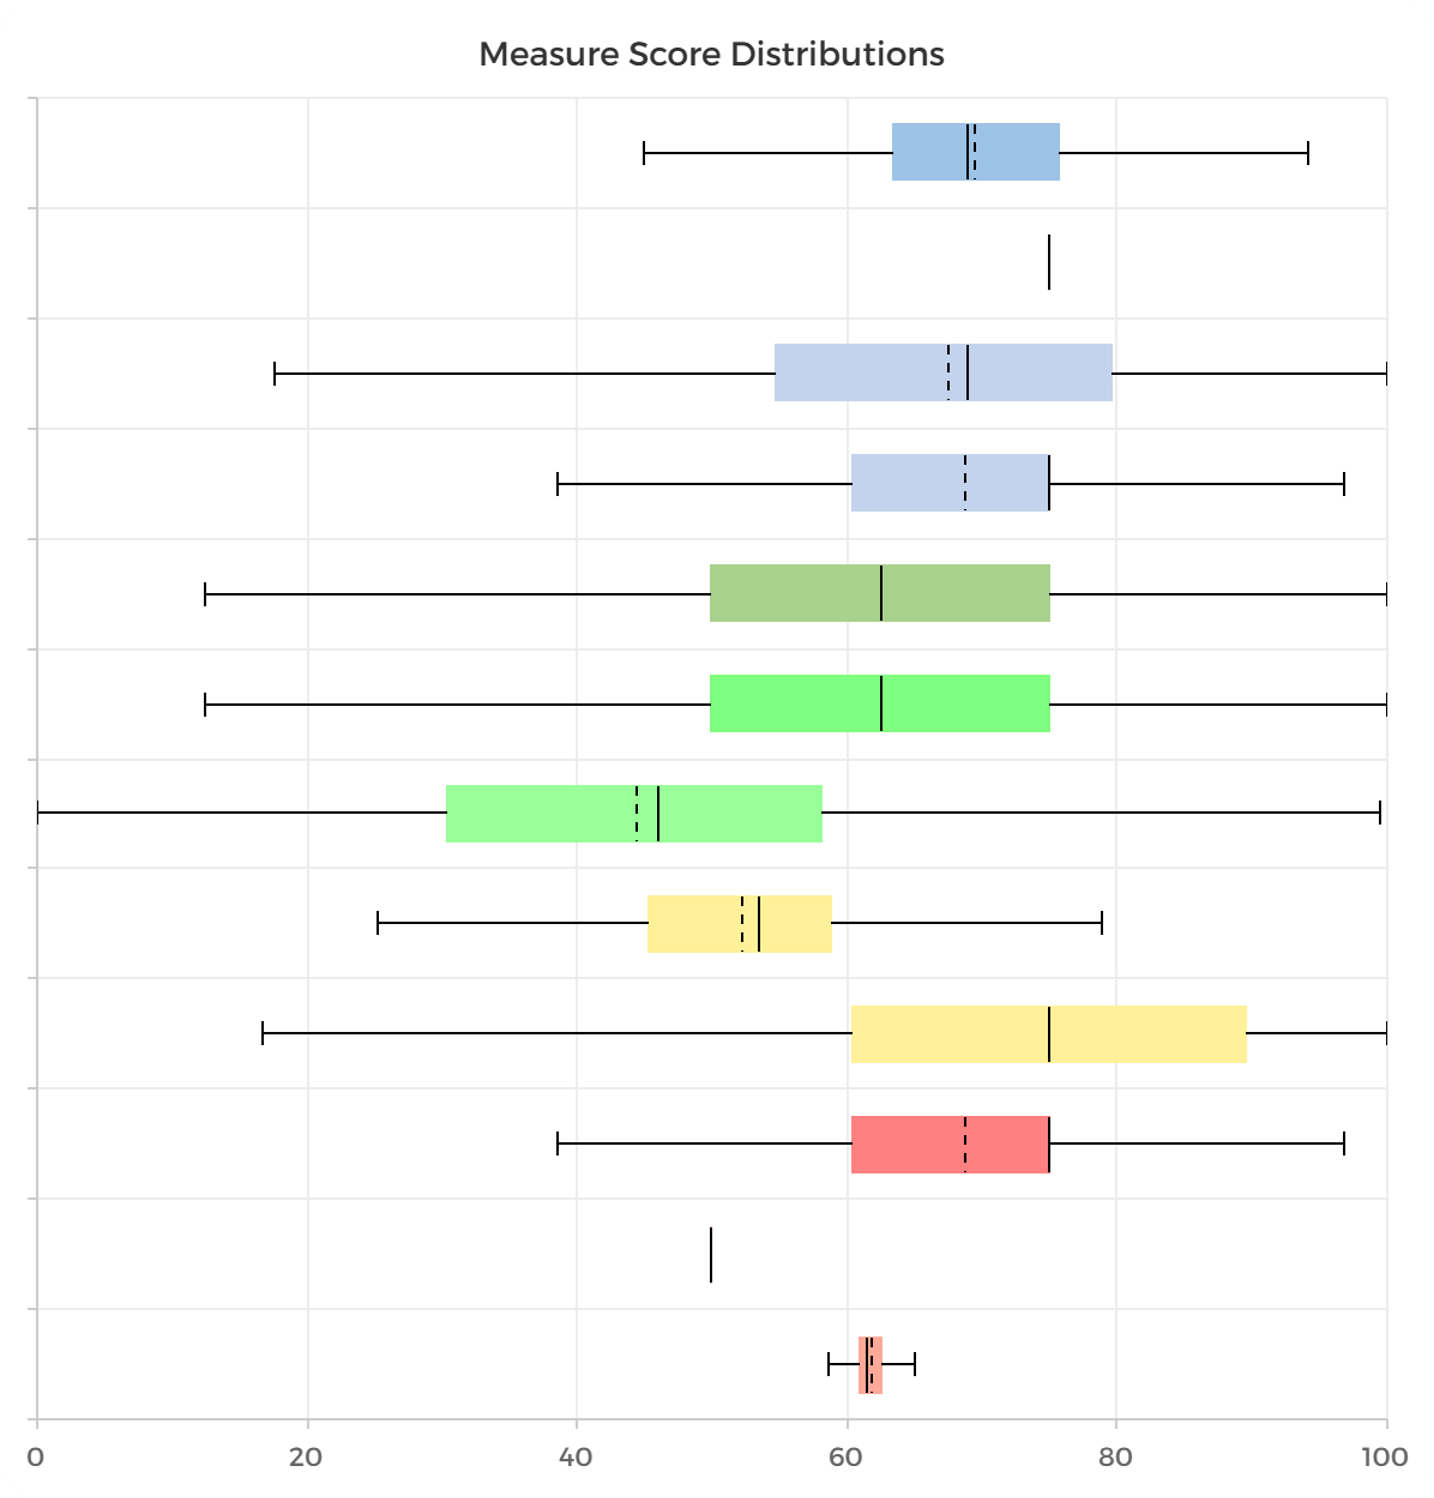
Question scores distributions.
Ranx was conceived to answer the question – “what do you do after the survey?”
Survey categories and questions are weighted according to their ranks.
Improvement potential is derived by analyzing weight, scores, and how much respondents agree.
Improvement potentials are analyzed and prioritized so you know where to focus.
